Inflation versus Unemployment
The Phillips Curve is a staple of macroeconomics. Should we retire it?
What is the Phillips Curve?

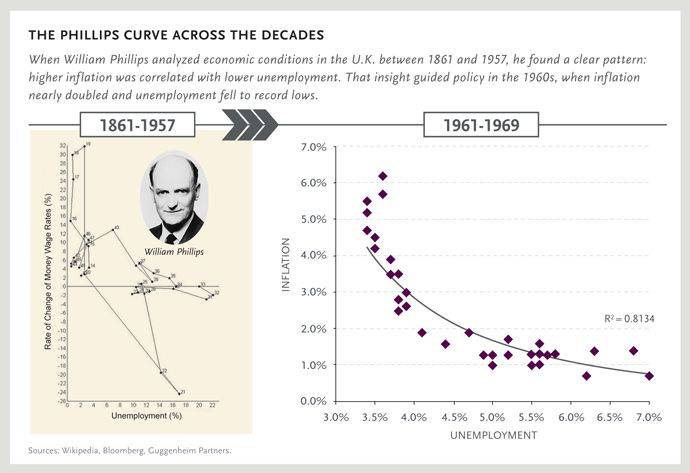
A key concept for the relationship between unemployment and inflation is the Phillips Curve. The Phillips Curve, named after New Zelander economist William Phillips, presupposes there’s a negative relationship between unemployment and inflation. It was first proposed by Phillips (hence the name) in 1958, in a paper titled “The Relation between Unemployment and the Rate of Change of Money Wage Rates in the United Kingdom, 1861-1957”, where he examined whether or not there was a negative relationship between unemployment and nominal wages. Building on this, Robert Solow and Paul Samuelson co-authored, “Analytical Aspects of Anti-Inflation Policy” (1960), where they link Phillip’s findings to the price level.
The insight here is simple: if unemployment is high, workers don’t bargain for higher wages and won’t change jobs, so employers can keep wages (and prices) low; and, on the contrary, with a really tight labor market, then employees can bid their wages up and prices rise faster.
The strength of this relationship is measured by the slope of the curve - if it was very steep, then small reductions in unemployment would lead to big hikes in inflation, and if it was flat then you’d need very big shifts in unemployment to raise inflation meaningfully.
Keeping it tight
A related concept here is that of the natural rate of unemployment, sometimes known as the Non Inflation Accelerating Rate of Unemployment (NAIRU), a concept introduced by Milton Friedman in 1968. Given that there is a maximum level of GDP possible at any given time, and that the demand for labor of each firm isn’t infinite, then you’d have to believe that there’s a minimum rate of unemployment in any economy, no matter how prosperous. Part of this story is that people change jobs (called frictional unemployment, which isn’t a big deal) and part is what’s known as structural unemployment, people for whom there is no job “available”.
The natural rate of unemployment is the lowest rate at which there is an “acceptable” level of inflation, because below that there is simply too much wage growth in ways that are actually harmful to workers - for example, if inflation at the NAIRU was 2%, they’d ask for raises of 2.5%, so prices would increase even more, which would cancel out the additional wage growth, and the cycle would repeat itself.
The NAIRU is clearly related to economic slack - the difference between actual GDP and potential GDP. Potential GDP is the GDP if the economy was running at full steam - so economic slack, also known as the output gap, is how much of a difference there is between it and what’s actually happening. According to mainstream models, the gap can be positive (where there’s too much production) and you’d have inflation, or negative, and you’d have too much unemployment. However, Friedman and Keynes (and also a large number of 60s economists) both spoke at some point about the output gap could being only negative. In either case, whenever there’s an output gap, unemployment is clearly not at the natural rate, so the two are tightly linked.
Putting the “flation” in stagflation
A conclusion of the prevalent views in the 60s was that unemployment would have to be really low to induce significant inflation, and that significant inflation would have to be accompanied, necessarily, by a very “strong” economy. But starting in the oil shock of the early 70s, there was a prolonged period when the economy was really weak (growth was slow and unemployment was high) but inflation was also at high levels, even as high as 10% - a phenomenon known as stagflation. This was a really big problem because it wasn’t supposed to happen, according to prevailing wisdom.
Exactly what happened is a big can of worms (I’ve written about it!), but the story is that stagflation ended after Fed Chairman Paul Volcker aggressively raised interest rates (sometimes up to 20%) in the late 70s, which raised unemployment but also lowered inflation rapidly - moving through the slope of a Phillips Curve that was much steeper than previously assumed.
The reason why things got out of hand is that economists were, to be blunt, wrong about the economy: they believed that the Phillips Curve was very flat, that the trade-off was very strong even in the short term, and that you could move very painlessly from normal unemployment to lower and lower unemployment rates, even from the inflation that this model predicted. These assumptions were very wrong (well, not the flat curve one), and, on top of this, the Fed kept getting potential output wrong. All of these mistakes led to the Fed to overestimate how much money they could pump into the economy. Plus, inexplicably, the Federal Reserve seemed to believe it couldn’t do anything about inflation - so it just kept pumping.
This led to economists thinking long and hard about their models and assumptions, and they ended up amending the Phillips Curve with expectations of future inflation and with past inflation - so that you could have inflation either "spill” from the past to today or people just not believing the Fed.
Expecting the unexpected
As mentioned above, the key parts of the Curve’s most common formulation aren’t the unemployment-inflation tradeoff, which can’t actually be exploited by policymakers, but expectations and inertia.
This means that the reason why Paul Volcker was so able to tame inflation wasn’t that he “slid” through the Phillips Curve but, rather, that expectations went down and stayed down due to his willingness to “spill blood, lots of blood, other people’s blood” to control prices. This boost to credibility also undermines an argument against a higher inflation target that Laurence Ball calls “‘the addictive theory of inflation”: that by raising its target, the Fed will go down a slippery slope into Argentina (or Venezuela) territory. If the Fed remains trustworthy, then 4% would just be the new 2%.
Although there is something to be said about expectations: Econ Twitter has been talking about a paper by Federal Reserve economist Jeremy Rudd. Rudd’s thesis is that inflation expectations don’t matter as much as the Fed thinks they do. When inflation is (temporarily) high, instead of asking for higher wages or raising prices in anticipation, most people do… nothing. Actually people start changing jobs because wages can’t keep up with prices, but that’s about it.
Besides from having far reaching policy implications that pose major challenges to stabilization efforts - for example, you wouldn’t be able to tell if the economy was overheating for years, by Rudd’s own admission, because increases in quit rates take a long time to seem abnormal - I think that it’s not because economists are wrong about expectations - quite the opposite in fact.
The Federal Reserve, since the 1970s, has built a reputation for being tough on inflation, whatever the cost (“lots of blood”). Ergo, when inflation is temporarily high, everyone trusts that it’ll make it go back down - whatever it takes. So inflation is never really a concern, which means people don’t usually pay attention to prices, resulting in expectations measurements being constantly off.
Dead on target?
Central Banks generally have two mandates, maintaining full employment and fighting inflation. The Phillips Curve is a very useful way to understand their mission - if they keep inflation under control, then unemployment must be at its lowest, and vice versa.
But here comes the big problem: how do Central Banks pick the inflation rate? One would assume that the inflation target would have been picked because it was the rate where unemployment would match the natural rate. Most Central Banks have inflation targets of 2% - how can 2% be the right target for every major economy?. Unsurprisingly, it isn’t - the figure comes from New Zealand’s inflation target during their stagflation in the late 80s, and the only reason it was picked was “the guy in charge said it on a TV show”. Sound reason!
Then, there isn’t any reason for the unemployment rate to actually be at the NAIRU when inflation is at 2%. This occurrence, that both mandates are actually one, is called “the divine coincidence”, and comes a certain set of fairly unrealistic assumptions. However, it’s pretty likely those conditions don’t hold, so the coincidence might be just that, a coincidence.
Dealing with “the inflation target is not compatible with the natural rate” is really hard. One way is to just define your way out of the problem and to go “well, the full employment is whenever you have 2% inflation”, or to do the inverse, and say “the inflation target is whatever percentage gets you to full employment”. Neither is very useful, and the latter is a particularly big problem - the Federal Reserve hasn’t actually been all that great at estimating the natural rate.
You could just raise the inflation target too, but that’s not really a solution as much as kicking the can down the road. Some more innovative solutions have also been proposed, such as nominal GDP targeting by libertarian economist Scott Sumner, or gross labor income targeting by progressive economist Skanda Amarnath. Needless to say, this is a serious matter.
Burden of proof
There’s another whole set of issues with the Phillips Curve framework (read more on my friend Joseph Politano’s post on the topic) - mostly regarding the empirical evidence or methodological (i.e. boring) aspects.


The first, and most obvious one, is that the Curve doesn’t have much evidence behind it (see above)- besides from Japan’s looking like Japan. The slope is much flatter than we thought- and has been for a really long time. This flattness is such a problem that there’s been a lot of talk of the relationship not existing at all.
All explanations point to one “problem”: what if the Federal Reserve doing its job decently is throwing wrenches into the process by which we estimate the effectiveness of the Phillips Curve at controlling inflation?
Let’s start with an analogy: imagine that you’re a crossing guard that has a button that makes all cars grind to a halt, and you have to press it every time there’s going to be an accident. If drivers think that you will always have their back, they will drive much more recklessly, increasing the chances of an accident. But let’s say drivers become much more cautious instead (say, because traffic accidents have a much harsher punishment in this world) - then, you’d never use the button, and everyone think it was pointless.
The Federal Reserve might act in the same way. Because their goal is to keep unemployment and inflation smooth, if they’re good enough at it, then the relationship between unemployment and inflation might appear extremely weak even if it isn’t - because the Fed keeps things running smooth and steady at a given range. Inflation can depend positively - and strongly - on economic slack even if it’s not showing in the data, just because the Fed keeps inflation low and slack as low as it can, but it’s much better (and more dedicated) to the former than to the latter.
A good place to look at is Hong Kong: because the island city has their currency, the Hong Kong dollar, tied to the US dollar pretty stably, their monetary policy is de facto set by the Federal Reserve. Because the Central Bank of Hong Kong doesn’t actually do monetary policy, then it doesn’t have stability in either employment or inflation - optimal interest rates aren’t necessarily the same as the Fed Funds Rate. Because of this, Hong Kong has a pretty robust Phillips Curve (unlike basically everywhere else) - giving at least some credence to the “too good at its job” theory. However, neither Ecuador, Saudi Arabia (dollarized economies), nor Denmark (similar to Hong Kong) have a stable Phillips Curve - so Hong Kong might be the odd duck out.
Finally, there’s an empirical problem with the way we tend to think about the costs of inflation (creating ineficiencies by making prices “noisy”): they hardly ever materialize, even during the Great Inflation. This is an “editorial” part, but the main cost of inflation is lower purchasing power and not really hard to parse abstractions. This is relevant because our understanding of inflation comes from the idea that nearly any amount of it is painful - when, in reality, the most pressing issues (purchasing power, disincentives to lend or save, higher inflation being really volatile) don’t materialize at every level.
Desperate times, desperate measurements
Additionally, the Federal Reserve hasn’t been all that good at estimating potential output (evidence: the 70s), inflation (which index is better, precisely?), and unemployment. For potential output, estimates are subject to a ton of measurement errors, plus the Fed frequently assumes things such as past growth being impossible to regain - meaning recessions have permanent effects on growth, which they shouldn’t have. Regarding inflation, the Fed has to juggle a ton of choices: headline versus core, core versus headline with no volatile components, multiple inflation indeces, and stuff like “mean PCE” or “core trimmed PCE”. And for unemployment, there’s two big mistakes: the natural rate, and mismeasurement.
Regarding the natural rate of unemployment, the Fed pegged it was above 6% in 2015, and then the economy hit 2.6% unemployment a couple of years later, with inflation below target. Regardless of whether 2% is too much or too little, the Fed simply assumed very odd things about the labor market, to the point where it codifies racial inequalities by supposing very high rates of unemployment for minorities for no reason other than “it happened”
Plus, unemployment doesn’t even do its basic job, i.e. answering the question “who doesn’t have a job”. Because it’s just the number of people who don’t have jobs but are looking for one divided for everyone in the labor market (them AND the employed), it can be “fooled” by labor participation. Because participation can actually go up and down with economic cycles, then unemployment could be “artificially” low (or high) by just fewer (or more) people looking for jobs - which might have happened in the 2010s. It also constantly mismeasures who is an unemployed person and who is a discouraged worker, creating weird biases in the data that make some conclusions be reverse if you adjust for it. If you measured labor market tightness by the employment rate (i.e. the number of people who do have jobs) then you could just use that as a much better indicator
Finally, the Curve itself is just muddled by messiness. Is there a correlation between output gaps and inflation, or output gaps and unemployment? Yes. Is there a correlation between unemployment and wage growth, and between wage growth and inflation? Also yes. But getting from the first question to “is there a correlation between unemployment and inflation” has you trawl through a behemoth of weird assumptions and oversimplifications. So looking at employment, inflation, labor income, and the output gap all together can get you to a better understanding of the economy than the weird Frankenstein(‘s monster) that is the Phillips Curve.
Conclusion
So, there is a tradeoff between inflation and unemployment, just not in the way we think. It’s more a rule of thumb than something you can actually exchange. But the conclusion to draw from what little we know is this: aggressive support for employment is good, and that how much inflation Central Banks tolerate is up to nobody other than themselves (well, and the public).
The main problems with the Phillips Curve framework are that it doesn’t really work unless you bite a million bullets and simply accept that this super shaky nonsense is actually workable, plus a plethora of methodological issues and nightmarish statistical quagmires. So why not get the annoying middlemen out of the way (multiple different inflation measurements, measurement errors, bad unemployment science, etc) and just pick a more reasonable way to do monetary policy?
Sources
Joseph Politano, “The Life, Death, and Zombification of the Phillips Curve”, 2021
The Phillips Curve
Del Negro, Lenza, Primiceri, & Tambalotti (2020) “What’s up with the Phillips Curve?”
The natural rate
Friedman, (1968), “The Role of Monetary Policy”
Matthew Yglesias, “The NAIRU, explained”, Vox, 2014
Stagflation
Romer (2012), “Commentary on the Origins of the Great Inflation”
Expectations
Rudd (2021), “Why Do We Think That Inflation Expectations Matter for Inflation? (And Should We?)”
The divine coincidence
Blanchard & Gali (2007), “Real Wage Rigidities and the New Keynesian Model”
Alves, 2013, “Is the Divine Coincidence Just a Coincidence? The Implications of Trend Inflation”
Blanchard, Dell’Ariccia, & Mauro (2013), “Rethinking macroeconomic policy: Getting granular”, VoxEU
The empirical evidence
Hooper, Mishkin, & Sufi, “The Phillips curve: Dead or alive”, VoxEU, 2019
McLeay & Terneyro (2019), “Optimal Inflation and the Identification of the Phillips Curve”
Scott Sumner, “Does the Fed set monetary policy in Hong Kong?”, EconLib, 2019
Measurement error
Mike Konczal, “How low can unemployment go?”, Vox, 2018
Dylan Matthews, “The Fed’s bad predictions are hurting us”, Vox, 2019
Joseph Politano, “The Fault in R-Stars”
Ernie Tedeschi, “Participation and the Hot Labor Market”
Skanda Amarnath and Alex Williams, “Beyond The Phillips Curve”


There are more countries whose Phillips Curve look like themselves: https://thefaintofheart.wordpress.com/2015/01/31/geography-is-a-great-predictor/
very nice article! congrats