


Poverty in 2020
The Catholic University of Argentina released its 2020 poverty report. It's not pretty


A month ago, I posted about poverty mostly using 2019 data. The same source I used for most of the data, the annual report by the Catholic University of Argentina, has recently been updated for the last year.
General trends and the labor market

Starting from an already high level of poverty, the situation got even worse, for both headline poverty (from 39.8% in 2019 to 44.7% in 2020), and for extreme poverty (from 8.4% in 2019 to 9.8% in 2020). While I find the idea that the increase in poverty in 2020 was smaller than in 2019 (4.9% in 2020, vs 6.2% in 2019), the main difference was that inflation was nearly 20 points lower, so the damage to purchasing power was much more contained.

The main channel for the increase to poverty seems to be the destruction of income sources in vulnerable households more than the deterioration of real wages like in the previous two years (employment was reduced in 2018 and 2019, but to much lower levels and accompanied by increases to more precarious postings). At the height of restrictions, the participation rate was 38% (vs 47% pre-covid) and the employment rate was just 32% (vs 48% in Q1), with 13% unemployment, then, if every person who lost their job kept looking for one, unemployment would reach 29%. In better paid formal sector losses were kept at a minimum, while poorer informal workers and precarious self-employed workers paid the steepest price. For example, in Q2 (the worst hit of them all), total employment decreased by 3.7 million compared to 2019, with 1.7 million of those losses being non-registered workers and 1.6 million being self-standing workers (vs 400k registered private sector workers and 5,000 public employees). There was a modest recovery by the end of the year, meaning that total employment losses were “just” 1.7 million, with 700,000 fewer non-registered workers and 500,000 less autonomous ones, plus 287,000 registered job losses.
Considering the 3.6% drop in real wages (after -9.5% in 2019 and -6.3% in 2018), and the fact that non-registered workers both suffered a much bigger decrease in purchasing power (-6.2% in 2020, -14.2% in 2019, and -6.5% in 2018) and that their average wage is 40% lower than for registered private workers, the material conditions of the most impoverished sector of the population have significantly worsened.
Who is poor?
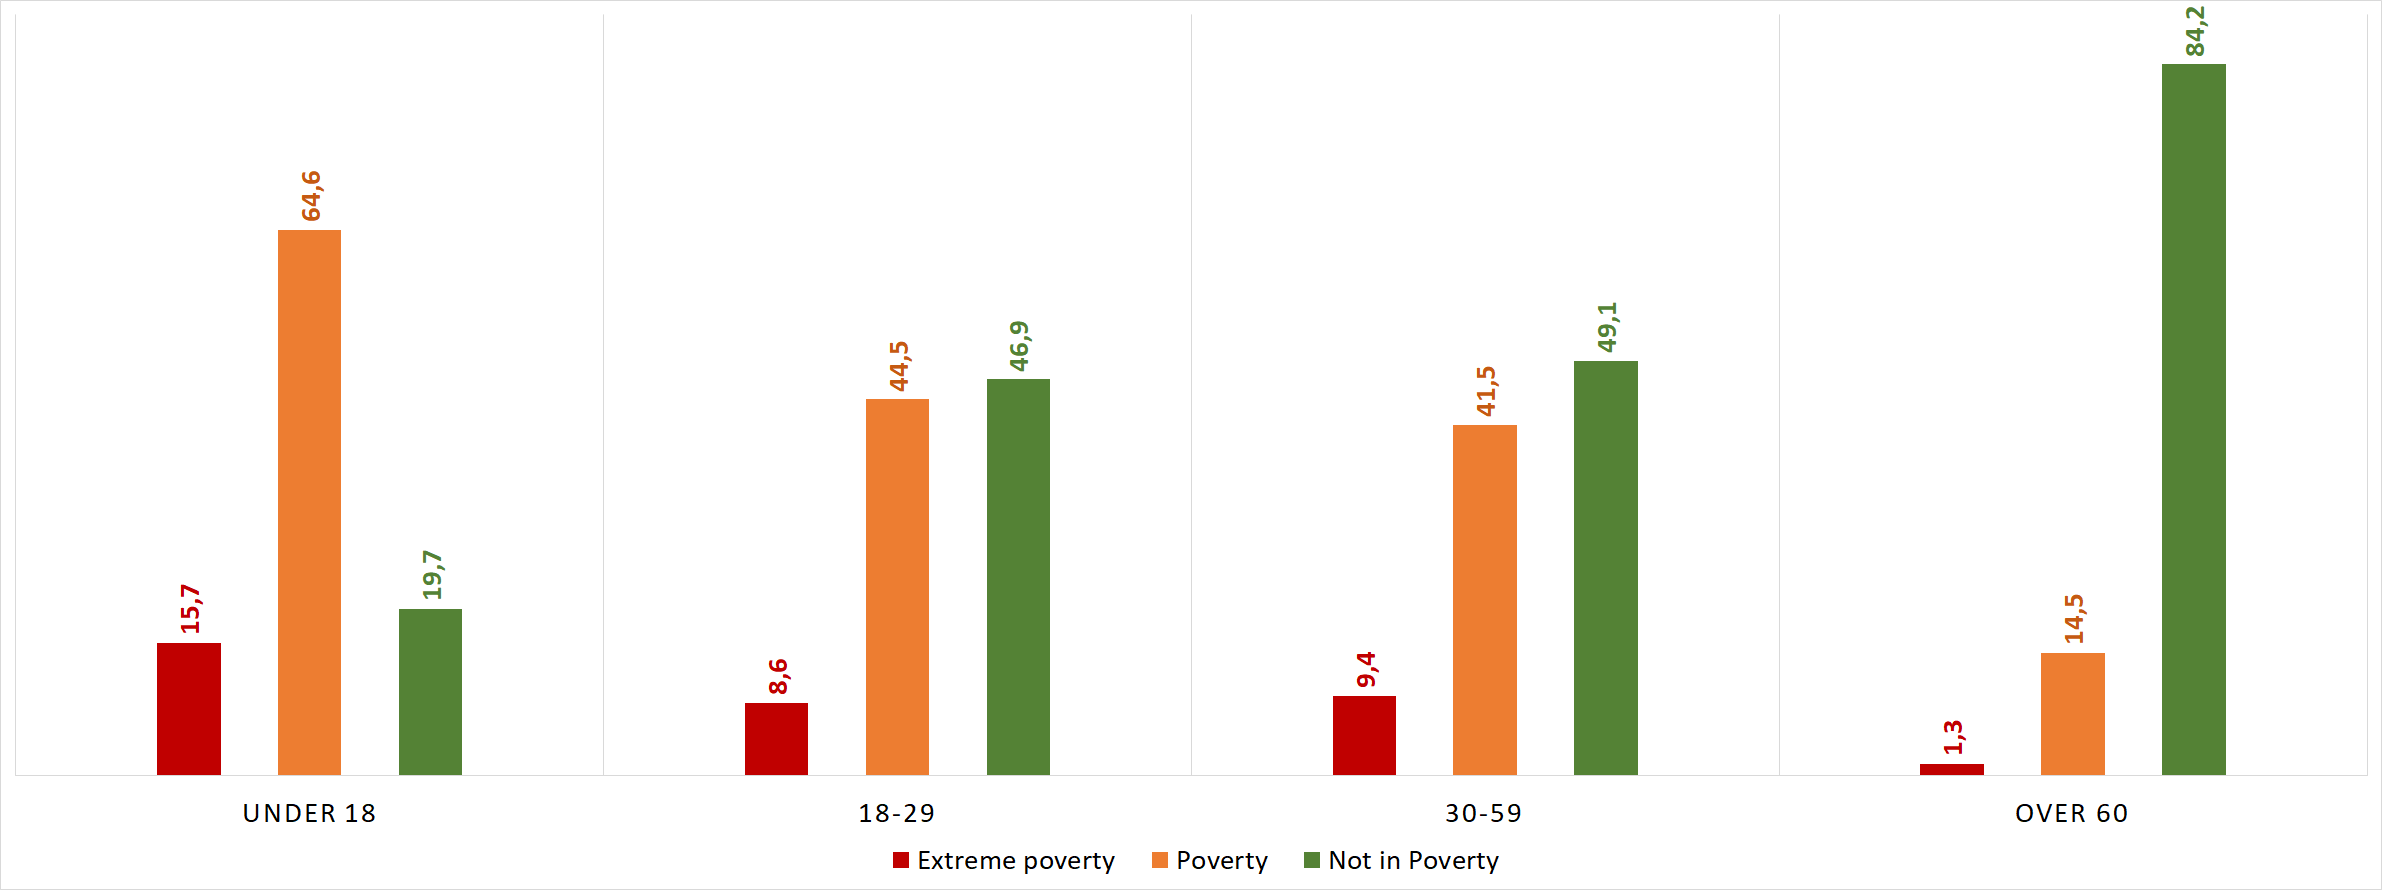
By age, the same worrying trends as before are continuing: the poverty rate for children has crept up even more, while the elderly remain in relative comfort. These trends have only deepened, as the poverty rate for minors grew 6.3 percentage points in 2020, while the poverty rate for the elderly only rose 1.3 points. This is closely linked to the fact that children disproportionately live in poorer families, while richer couples have fewer children and are disproportionately old.
For all households, the percentage of people who were in poverty in 2019 and remained was 22%, and “new” poverty” was 13%. Now, if you separate between households with children and without them, the causality becomes even clearer. For households without children, 77% weren’t poor in 2019 and remained so, and just 6% were poor in both years - with 11% transitioning into poverty in 2020. In comparison, jusr 32% of families with underage children weren’t poor in either year, while 41% were poor in both - and 16% who weren’t poor in 2019 fell below the poverty line in 2020.

Regarding class, existing trends deepened in 2020. While upper professional classes remained protected from the pandemic, it is worth pointing out that increases in poverty grew unevenly across groups. There was a 5 point increase in qualified laborers, from barely a majority to 55%, and a 12 point hike for the most impoverished workers at all, so over three quarters live in poverty. In comparison, poverty declined 1 percentage point for the middle class, and grew less than a percentage point for professionals.
Analyzing trayectories in the same way as family composition, 94% of profesisonal class households weren’t poor in either year and just 5% became poor in 2020. For middle class non-professionals, 73% weren’t poor in either year and 5% were poor in both, but a more significant 18% became poor in 2020. For lower class workers, 42% were poor in neither year, and 35% were poor in both, while 12% entered poverty and an equal 11% left poverty in the last year. Finally, the marginalized lowest stratum had 36% of families in poverty both years an a paltry 33% being non-poor in both 2020 and 2019, while 15% of the total both left poverty and entered it.
Geographically, poverty is concentrated in the Buenos Aires Metro Area (home to 40% of the population), where 56% of people are under the poverty line, and 14% are below the extreme poverty line. In comparison, only 13% are poor in the City of Buenos Aires proper, and 40% or so in the rest of the country - with extreme poverty rates of 4% and 7% respectively.
Living conditions

Living conditions in various qualitative indicators worsened compared to 2019, albeit at a limited scale since a large number of them are simply caused by long-term changes in public urban infrastructure. The 6 main categories are food insecurity and lack of healthcare, lack of basic public services (sewag, running water, electricity), precarious and/or overcrowded housing, unsafe enviroments, inadequate education for minors, and no registered income (either labor or retirement pensions). Of these, all of them worsened by at least half a percentage point of households and one percent of the population (population-wise, the % of people with food insecurity didn’t change).
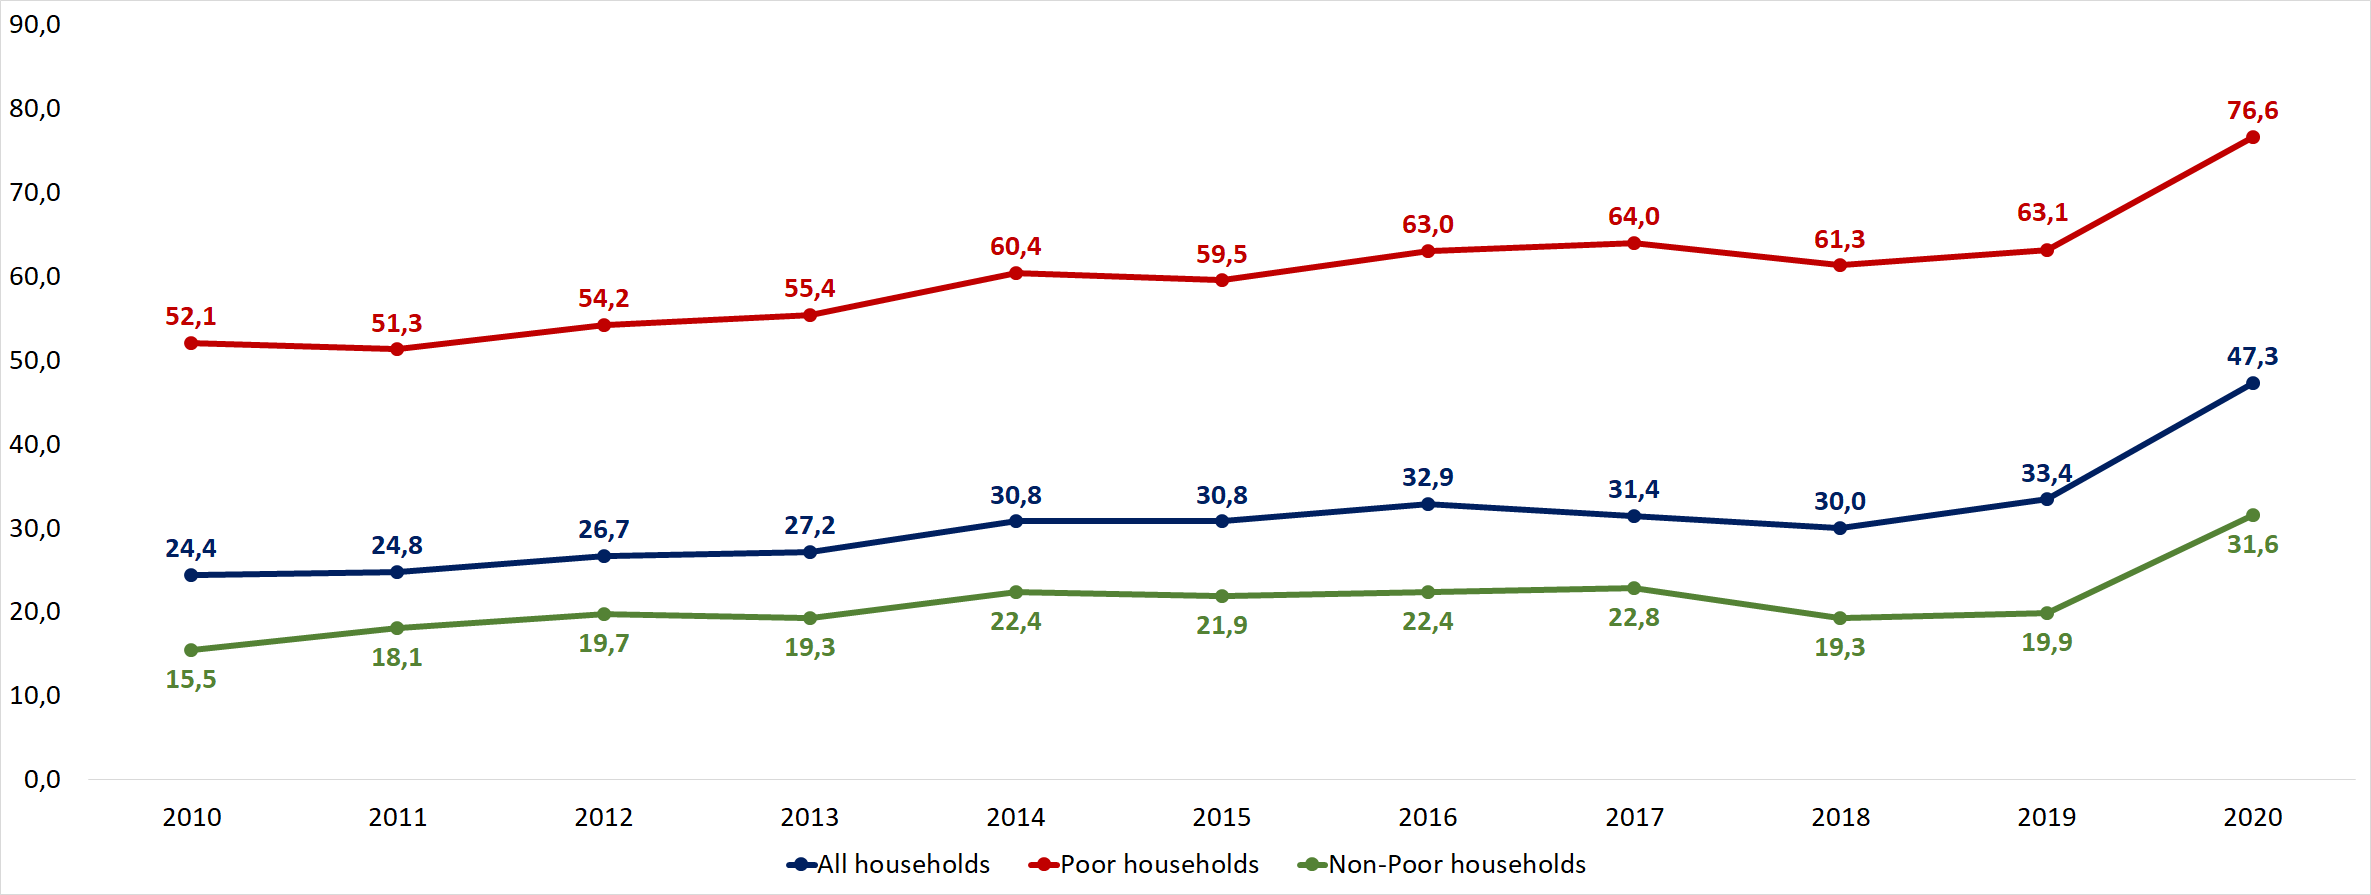
Despite decreases of at least 0.5% in 2020, access to sewage, running water, and electricity has decreased continuously since 2010 until 2019. The same is true for quality of housing, and environmental safety (garbage dumps, polluted waters, or polluting industrial plants in the vecinity). All of these suffered from minor setbacks, in absolute terms, and it can be expected that when an economic recovery begins, they would revert to previous trends - caused by long-standing public policy commitments.
On the other hand, access to food and healthcare, education (for minors), and employment quality all worsened. While the percentage of people who didn’t access medical care or medicine showed small hikes consistent with previous trends, while severe food insecurity increased 2 percentage points in 2020, from 7% of the population to 9%. The educational attainment of adults continuued decreasing in 2020, due to (again) long-standing progress in eliminating illiteracy and abandonment. In comparison, the dropout rate for minors (i.e. people currently in school) doubled in 2020, from 2% to 4% of children in households (and 12% of the underage population), and erasing a nearly a decade of consecutive decreases. This ties with wrong-headed policies that kept schools closed for the entirety of the school year (March to December) across the country. We have already looked into labor market outcomes, but the share of workers without registered employment or social security benefits increased 3 percentage points in 2020, to 33% of households having the main breadwinner be non-registered.
The intensity of non-monetary poverty, i.e. how many needs are unmet, slightly but steadily increased in 2020 as a share of the population, with a 0.5% hike in one unmet need (from 68.7% to 69.2%), a small decrease in two needs (from 46.2% to 45.7%), and a large increase in three or more needs (from 28.4% to 30.3% - the highest value since 2010). This led to a slight change in the composition of household poverty, with the percentage of people who are poor in both “counts” (insufficient money and unmet needs) increasing 2.5 percentage points to 33%, at the expense of people who only had unmet needs (which went from 36% of the population to just 33%).
We can define structural poverty as the poverty of people who have both incomes below the poverty line (monetary poverty) and 3 or more unmet basic needs. The percentage of people in structural poverty increased 3 percentage points in 2020, to 24%, while poverty in people with two unmet needs declined slightly (from 8.5% to 8.2%) and poverty in people with just one unmet need increased 2.5%, from 7% to 9.4% (the share of people in poverty with no unmet needs is very low, at a steady 2% of the population for the entire decade).
Government assistance
In 2020, a record 47% of households received government assistance, representing 55% of the population - a double digit increase in both counts (from 33% and 44% respectively in 2019). This figure was a decade-long record for basically every relevant group: poor (77%) and non-poor (32%), for all classes, for alll levels of education, and with or without children.
In addition to the main program, the Universal Child Allowance, two new programs were created in 2020. The first was the ALIMENTAR food voucher, which guaranteed a small amount of money for mothers of children under 6. The second is the Emergency Family Income or IFE, six lump sum transfers of $10,000 every other month for families without a registered employee.
Even if their magnitude was small (for example, the AUH has been recorded to mostly lift out of poverty people whose incomes were already close to the poverty line to begin with), their impact on poverty was significant.
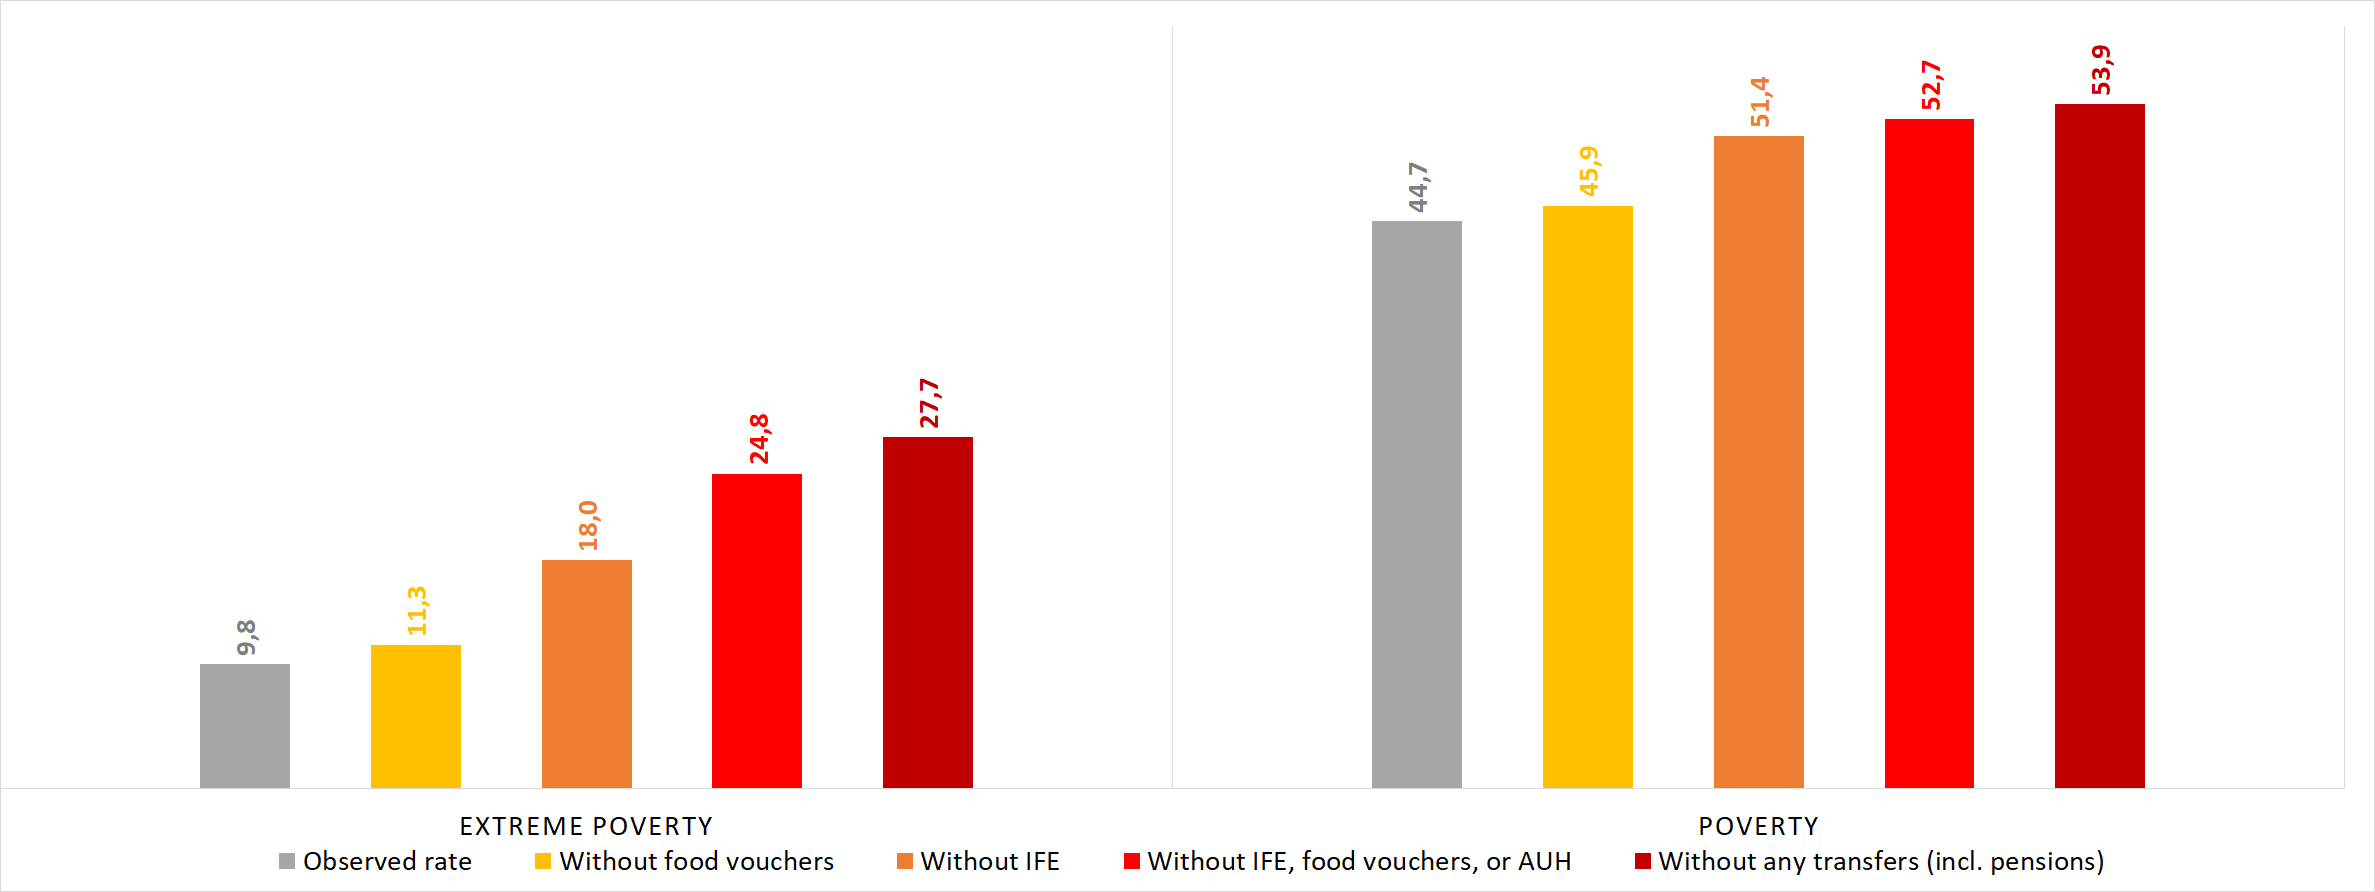
Regarding extreme poverty, preexisting programs alone cut the rate by 10 percentage points, while additional ones reduced it by a further 8. The single most successful of these was the IFE, with a 7 point reduction on its own, while the AUH cut the extrem poverty rate by 5 points (almost two thirds of the total reduction) and the ALIMENTAR vouchers slashed it by 2. For poverty specifically, all programs were unanimously less successful. The IFE also saw a 5 point reduction in poverty, but the effect of the AUH was much smaller (just 1 point less), and as big as the food vouchers. This means that existing welfare programs were effective at reducing extreme poverty but not “regular” poverty, and were effective at narrowing the dispersion of income within poor people.
The ineffectiveness of poverty alleviation programs makes sense considering that the gap between an indigent household’s average income was 13,000 pesos and the indigence line was 22,000, while the gap between the poverty line and the average income of a poor family was 21,000 pesos (much more than the combined value of all programs for a family of 4).
Conclusions
The situation, as shown above, remains dire. Additionally, high levels of inflation and a stagnant labor market, plus additional restrictions due to a covid second wave, will prevent a full recovery of the social conditions. By most expert estimates, the country needs 15 to 20 continuous years of 3% annual GDP growth to reduce poverty by half and return to 2017 levels - a tall order, since this feat hasn’t been accomplished in a literal century.
In addition to counterproductive macroeconomic and pandemic-containment policies, the country also has a cripplingly small welfare state. Even if the policies did have an impact, their extreme means testing (for example a household of 4 with one registered employee is only barely above the poverty line, but does not get any assistance) means that they don’t make much of a change in either direction. The big reason for this gap in poverty reduction programs is a bad allocation of public funds, which are generally spent more on buffing up the (already high) incomes of the elderly, inefficient public employment, or regressive energy subsidies.
The only source for this was the 2020 UCA poverty report: “Impacts of the COVID-19 Pandemic On Wellbeing In Urban Argentina” (in Spanish)